Graph Tab

The graph tab converts the split times' numbers to lines, curves, bars, and colours, thereby providing a quick and accessible overview of the information. There are over 30 different graph modes to choose from. The modes are divided into several categories: Time, Place, Performance index, Pack running, Time loss and Legs. The information field under the graph explains the chosen graph's contents and symbols. You can use buttons and text boxes in the tab toolbar to adjust the graph's appearance. For example, you can change zoom level, line thickness, and the axes' limits.

Show information about a graph object

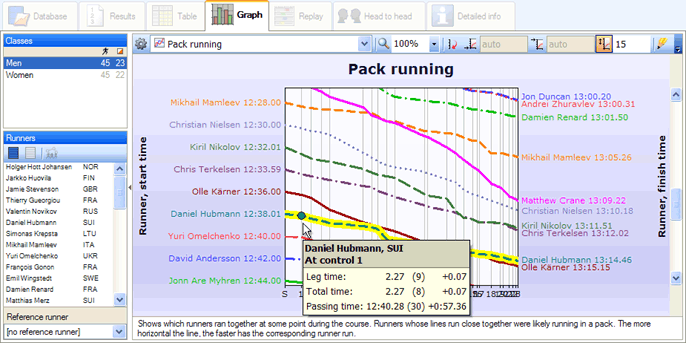
When you hold the mouse cursor over an object in the graph, (for example, a bar or a line segment) a box containing information about the object appears. In some cases, several information boxes are associated with an object. You can press Enter or Space to switch between them.

Show only certain runner and legs

Each graph mode displays a certain number of runners by default. If you want to include more or fewer runners, select the desired runners, either in the runner list on the left in the program window or in thetable tab. In order to include only certain legs, go to the table tab and select the desired legs there. The graph window is updated automatically when selections have been made.

Graph types

WinSplits Pro kan show seven different types of graph.

Icon Type Description
Line Shows how values change over time.
Horizontal bar Compares different groups of data as horizontal bars consisting of one or several segments.
Vertical bar Compares different groups of data as vertical bars consisting of one or several segments.
Colour scale A matrix-based graph type, in which each value is represented with a certain shade of a chosen colour, with the darker hues indicating higher values.
Density curve Shows the distribution of a collection of data (such as leg placings) using a curve. A peak of a curve indicates an accumulation of data points at the corresponding position.
Density colour scale Shows the distribution of a collection of data using a colour scale. The darker the colour at a certain position, the higher the concentration of data points around that position.
Histogram A bar graph that shows the distribution of a collection of data. Data points are divided into different intervals, each of which is represented by a bar.

Print a graph

Choose File > Print or File > Print preview from the menu or click on the buttons or , respectively, in the header toolbar in order to print a graph on a printer.

Export a graph

Choose File > Export tab contents from the menu or click on the button in the header toolbar to export the graph to a picture file in jpg-, gif-, or png-format.

Tab tolbar

The selection of buttons in the tab toolbar depends on the type of graph you are looking at. Therefore, not all of the buttons described below are shown at the same time.

Icon Function
The current graph mode's name is shown in the box. Ctrl+, shows previous mode, Ctrl+. shows next mode.
Shows the zoom level for the graph in percent. Ctrl++ zooms in, Ctrl+- zooms out, Ctrl+0 resets zoom to 100%.
Indicates if the maximum value along the x-axis should be on top or at the bottom.
Minimum value along the Y-axis. When the button is activated, the minimum value can be adjusted in the text box to the right. Otherwise, auto will be shown in the text box in gray, and the minimum value will be automatically fitted to the lowest value in the graph.
Maximum value along the Y-axis. When the button is activated, the maximum value can be adjusted in the text box to the right. Otherwise, auto will be shown in the text box in gray, and the maximum value will be automatically fitted to the highest value in the graph.
Shows the scale of the y-axis, that is, the number of pixels corresponding to a single graph unit (such as a minute or a percent). When the button is activated, the scale value can be adjusted in the text box to the right. Otherwise, the value is set automatically, and the text box will show auto in gray.
Shows line width factor in percent for objects in line and density curve graphs.
Shows or hides the graph's legend.
Indicates the minimum bar width in pixels for bar graphs or histograms.
The list box allows you to change the appearance of the colour range.
Indicates whether the colour range should be discontinuous. A discontinuous colour range does not have gradual colour changes, but instead consists of several different shades of the chosen colour.
The gradient's minimum value shows which value should be associated with the colour range's starting colour. When the button is activated, the value can be adjusted in the text box to the right. Otherwise, auto will be shown in the text box in gray, and the minimum value will be automatically fitted to the lowest value in the graph.
The gradient's maximum value shows which value should be associated with the colour range's end colour. When the button is activated, the value can be adjusted in the text box to the right. Otherwise, auto will be shown in the text box in gray, and the maximum value will be automatically fitted to the highest value in the graph.
Minimum value along the X-axis. When the button is activated, the value can be adjusted in the text box to the right. Otherwise, auto will be shown in the text box in gray, and the minimum value will be automatically fitted to the lowest value in the graph.
Maximum value along the X-axis. When the button is activated, the value can be adjusted in the text box to the right. Otherwise, auto will be shown in the text box in gray, and the maximum value will be automatically fitted to the highest value in the graph.
The smoothing factor indicates how "smooth" or "spiky" a density curve will appear. A higher smoothing factor leades to wider/softer peaks in the density curves (or colour bands in the density colour range graphs). A lower smoothing factor leads to narrower/spikier peaks.
Shows the length of an X-axis interval in a histogram. A larger value means fewer histogram bars.

Shortcuts

The following shortcuts can be used for navigating a graph that has vertical and/or horizontal scroll lists.

Shortcut Function
Ctrl+, Shows previous graph mode.
Ctrl+. Shows next graph mode.
Ctrl+- Zooms out.
Ctrl++ Zooms in.
Ctrl+0 Resets zoom level to 100%.
Ctrl+Page Up Shows previous class.
Ctrl+Page Down Shows next class.
Ctrl+R Deselects all runners and legs.
UpArrow / MouseWheelScroll Scrolls one step up through the graph.
DownArrow / MouseWheelScroll Scrolls one step down through the graph.
Ctrl+UpArrow / Page Up / Ctrl+MouseWheelScroll Scrolls one page up through the graph.
Ctrl+DownArrow / Page Down / Ctrl+MouseWheelScroll Scrolls one page down through the graph.
LeftArrow / Shift+MouseWheelScroll Scrolls one step to the left through the graph.
RightArrow / Shift+MouseWheelScroll Scrolls one step to the right through the graph.
Ctrl+LeftArrow / Shift+Page Up Scrolls one page to the left through the graph.
Ctrl+RightArrow / Shift+Page Down Scrolls one page to the right through the graph.
Home Jumps all the way to the left in the graph.
End Jumps all the way to the right in the graph.
Shift+Home Jumps all the way up in the graph.
Shift+End Jumps all the way down in the graph.
Ctrl+Shift+Home Jumps all the way up and to the left in the graph.
Ctrl+Shift+End Jumps all the way down and to the right in the graph.

Tips

  • In order to quickly show a graph with just runners from a certain club, right-click on one of that club's runners and choose Select all runners from [club name].