WinSplits Pro - an overview: page 2 of 3
Table
The Table tab presents split time information in the form of a table. There are several different table types you can choose among from the list in the upper left. The traditional table with times and places for each leg is provided by default, but there is a number of other tables available as well. Most table cells contain additional information that can be accessed by holding the mouse cursor over the cell.
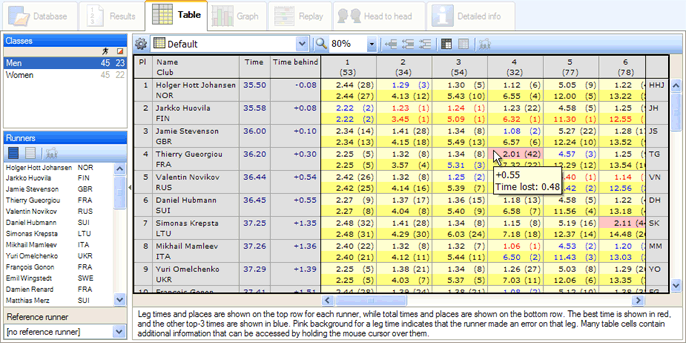
The standard table shows the split and total times and places in the traditional format
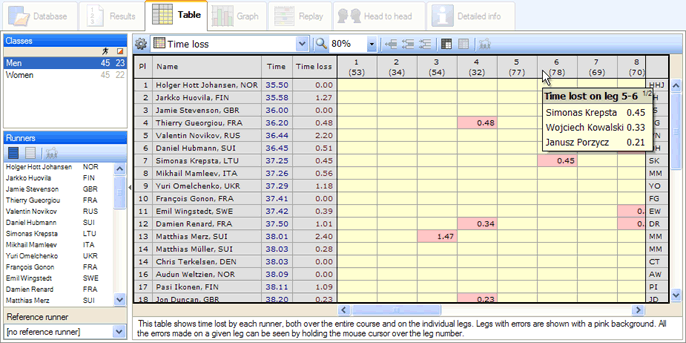
The Time Loss table shows how large a mistake each runner made at each control.
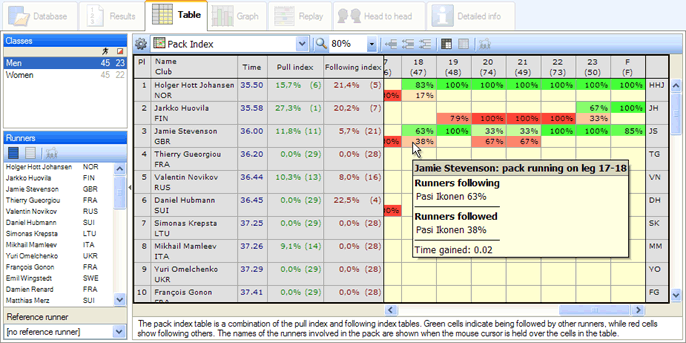
The pack index shows if a runner was following (red colour) or being followed by (green colour) other runners during the race.
Graph
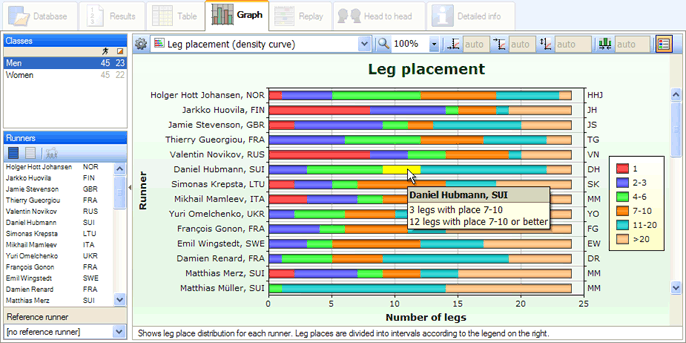
WinSplits Pro contains more than 30 different graphs that present split times from many different angles. The toolbar above the graph itself allows the user to fine-tune the graph's appearance. If you want the graph to only include several specific runners, you can selected the desired runners from the list on the left. Additional information appears in a box when the mouse cursor is held over that box.
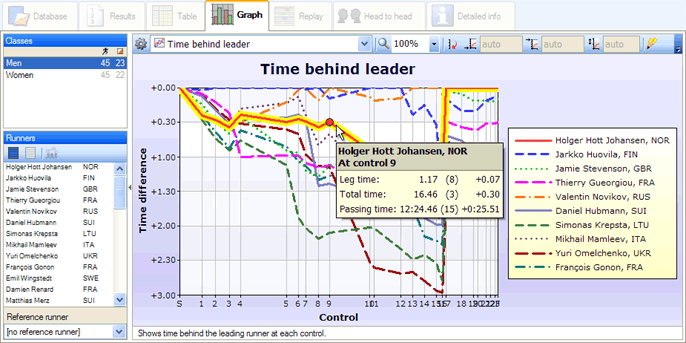
Holger Hott Johansen took the lead for the first time at the 17th control.
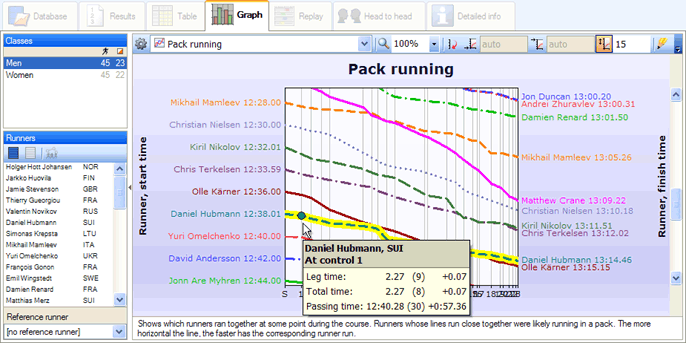
Kiril Nikolov and Chris Terkelsen ran together for the last part of the course.
Jarkko Huovila and Valentin Novikov won the most legs, eight each.
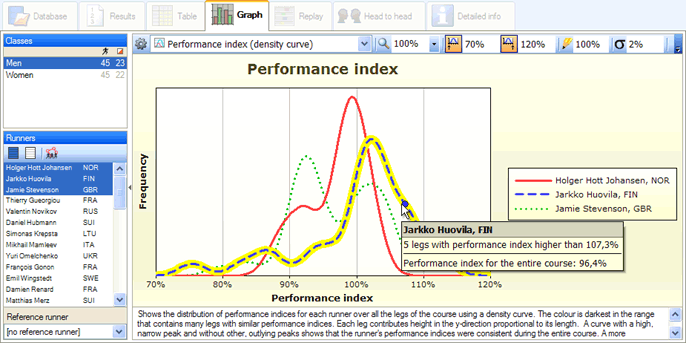
Performance profiles for the runners that are marked in the list on the left.
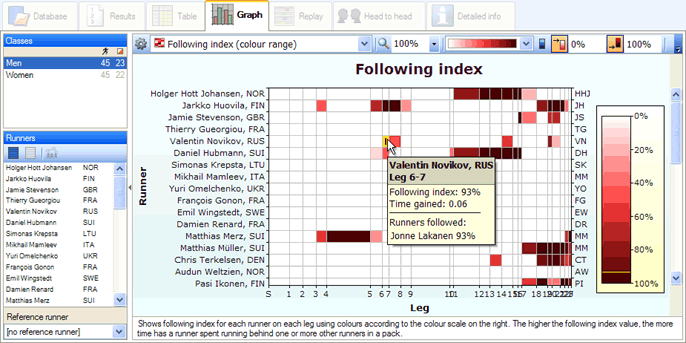
The redder the colour, the more the runner followed.
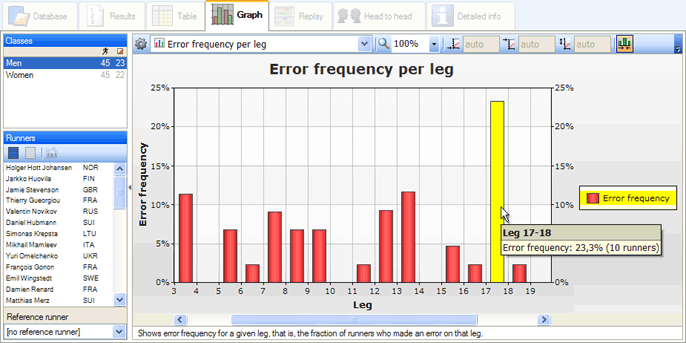
Control 18 must have been tricky.