WinSplits Pro - an overview: page 3 of 3
Replay
The Replay function in WinSplits Pro is very illustrative. It simulates a replay of the race, with animated figures running across the screen. The replay shows the runners' relative positions on different parts of the course, as well as their current places and times behind the leader. The speed of the replay can be adjusted, and the replay can be started from any point in the race simply by clicking on the desired point on the screen. Just as with the Table and Graph tabs, there are several different types of replay available, each of which shows information in a different way.
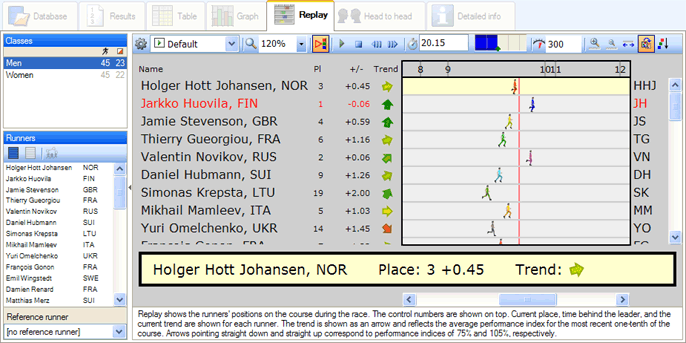
Simulated mass start. Jarkko Huovila is in the lead just before control 10, but Valentin Novikov is not far behind. Arrows show the runners' current trends.
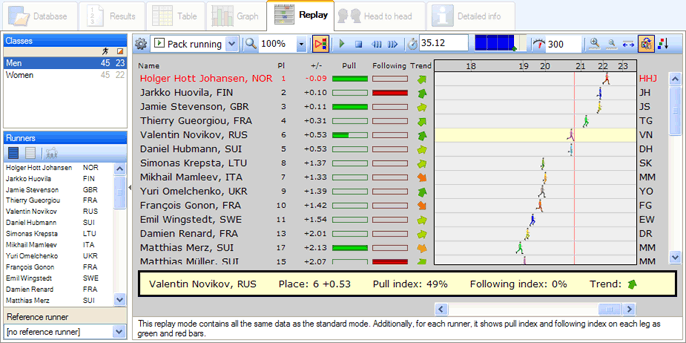
Close to the finish. The pack running mode contains bars that show runners following (red) or being followed (green) at the current position on the course.
Head to head
The Head to Head Tab contains a matrix that shows the mutual results for each pair of runners. That is, you can see how many legs a runner won or lost in comparison with each of his or her opponents. Hold the mouse cursor over a cell in the matrix to see a box with information about the head to head race between the runners in the given row and column. You can also select certain runners, and see the head to head statistics just for those runners.
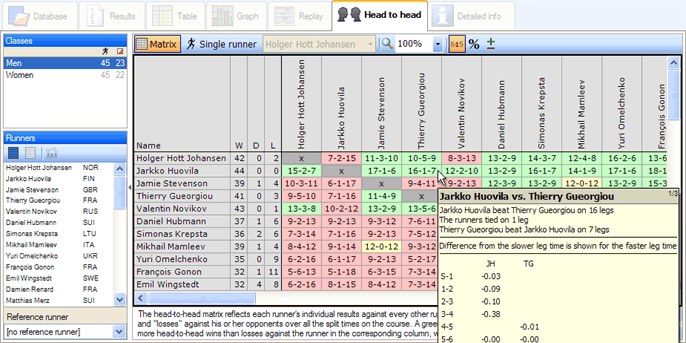
Jarkko Huovila has positive results against all 44 other runners in the race.
Detailed info
The Detailed Info Tab presents a number of properties (for example, split time, Superman's time, time lost, error-free time, all the errors made on a given leg, or following index) for a class, runner, or leg on the left part of the window. The middle part shows a list of runners or legs sorted by the property you selected from the window on the left. If there is additional information available about the selected property for the current runner or leg, it is shown in the right part of the window.
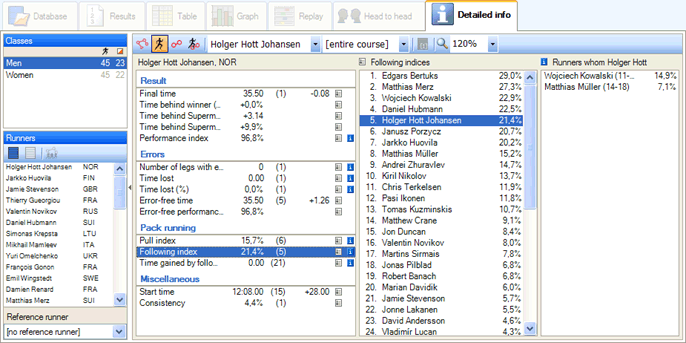
Holger Hott Johansen's following index over the whole course was 21.4%, which was the 5th highest value. Edgars Bertuks had the highest value with his 29.0%. Holger was right behind Wojchiech Kowalski between controls 11 and 15 and behind Matthias Müller between controls 14 and 18.
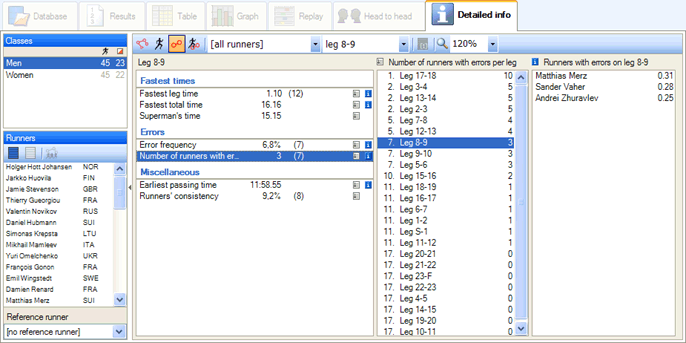
Three runners made mistakes on leg 9-10. Leg 17-18 caused most errors. Sorted error times are shown in the list on the right.
Other functions
- Calculation of time lost due to errors is done with a new and better algorithm
- Automatic program updating downloads and installs updates and bug fixes without annoying the user
- Split time data can be uploaded from all normally used file formats and competition administration systems (i e IOF XML, OE200x, OS200x, OLA, eTiming, Pekka Pirilä, SOLV)
- It is possible to create custom classes, including particular runners or controls
- Easy to see split times for all the classes on the same course
- The program can be run in full-secreen mode and, thus, used for presentations on a large screen
- Advanced printing capabilities for results, tables, and graphs
- Data can be exported as png, gif, jpeg, html, txt or xml files